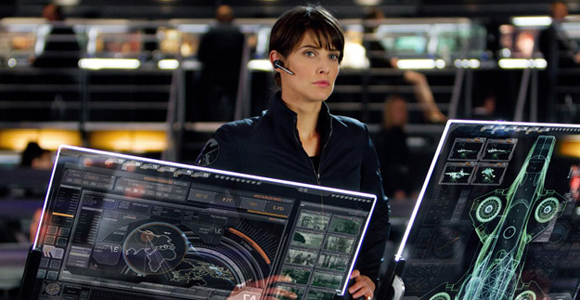
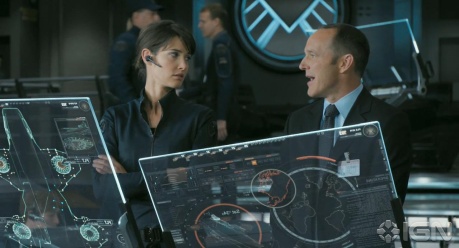
Data Visualization in The Avengers
I took in The Avengers this weekend.
The data visualization was pretty amazing, complete with very impressive information architecture. Half of a scene was done through a screen. Bruce Banner worked on simulation for about a 20 seconds, and with a single hand gesture, swiped it across the room to Stark’s screen. Stark immediately began working with it.
That swipe took all of 1 second. Currently, the amount of time it takes me to do the equivalent with a fellow data scientist is around 4 minutes. (Save, upload files to Duck, verbally say ‘it’s there’, download, open the application, load, run the script, render the view, continue).
Many of the digital experiences were three dimensional and could be engaged with. It’s a pretty compelling artistic vision of the future that I could see being useful. If you make it easier for scientists to work with one another, especially when it comes to sharing data models and simulation, you get a pretty strong boost in productivity.
I’m serious about the swiping.
***
I’m Christopher Berry.
I tweet about analytics @cjpberry
I write at christopherberry.ca


