
Analytics of music: Beluga Analytics
Have you seen Beluga Analytics, the open insights platform made available by Grooveshark?
It’s pretty sweet.
Enter in the name of a band and gain a whole range of data about that band’s audience.
This just isn’t interesting. It’s absolutely fascinating.
(Statistics ahead! A Z-Score means “how far from the average is a given group”. The higher (or lower) the Z-score, the more unusual a group is.).
Let’s compare two very different bands: europop sensation Aqua against Hipster favourite The Flaming Lips.


Aqua listeners are female, and disproportionately young. They’re more likely to listen to music while doing chores, hanging out, and surfing.
And, hay, that’s something you didn’t know before.
Next, check out the Hipsters.

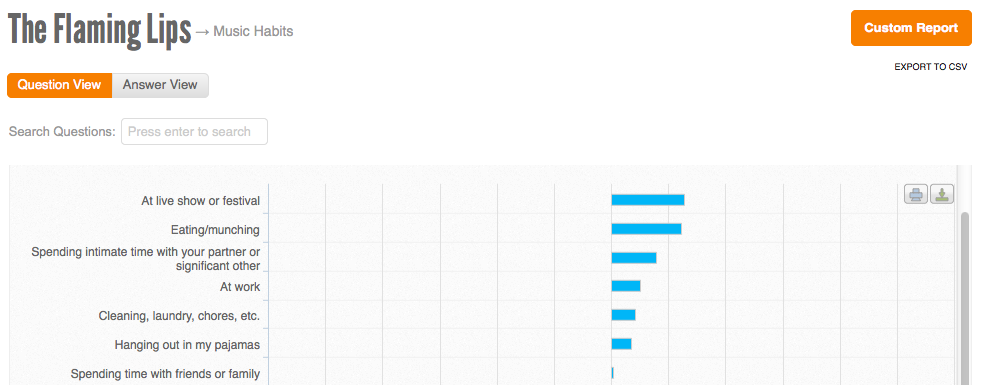
Males, 25 to 34 and quite a few Hipsterettes listen to The Flaming Lips. And what do they do while listening to music? A live show, while eating, during sexytime, and at work. Oh, and there’s some overindexing on chores.
Why this matters
The CD sales database is used quite often by academic Marketing Scientists to run word of mouth studies. It’s an overused database because it’s incredibly rich. Music (the band is the brand, the medium is incidental) is among the most social of products. Groups of people exhibit great likeness around music (In the MS jargon: high homophily). It’s highly generational. It’s extremely social. It’s the one sector that has been intensely disrupted by digital.
Music matters tremendously in social analytics, because many of the latest laws that social analytics practitioners, and certainly social marketing scientists use, come from that domain.
Just spending some time with this interface and exploring will make you smarter.
Thank you to the Grooveshark and Beluga teams for putting this together. It’s fantastic.
***
I’m Christopher Berry.
I tweet about analytics @cjpberry
I write at christopherberry.ca