
A Problem With Segmentation (With Simulation)
My contemporaneous notes from a particular INFORMS Marketing Science Conference six years ago feature the letters W, T, and F scrawled in the margins a few times. I learned of a deeper problem lurking in the way we were using the crosstab to identify segmentation. In this post, I’ll unpack a heap of jargon and lay the concern bare.
To the twenty or so marketing scientists in the room at the time, I read concern on the faces of about a dozen. It was a atypical because typically that community doesn’t get concerned about too much. One leader remarked that most in industry were not even executing basic segmentation on their users, so it wasn’t a huge industrial concern, but for marketing scientists in academia, this could be a very bad problem. For industry, for market researchers, it was about reporting basic univariate means – that 22% of consumers would buy purple paper towel, or that Obama would win 51% of the popular vote – were no problem and where the action was. Segmenting consumers, that 55% of women with dogs bought paper towel, was a different matter. Another gentleman, one of the four grandees I knew from the era, repeated, as though to wave everybody else off from the problem, that somebody he had supervised in the past was working the underling problem.
If the presentation ever made it to publication, I can’t find it. And I’m having a very tough time locating the specific author, or if there was ever just a simple resolution.
The problem originates with the way we understand ground truth. So let’s start there an unpack it all.
Assume a Universe. This Universe exists entirely within the RAM of my machine. Or yours. And in this Universe, I create a hundred thousand humans. And I assert two things about each of them. Attribute A and Action B. Either somebody has Attribute A, or they don’t. They either have a 1, or a 0. And they will imminently do Action B. They will either do B, a 1, or they won’t, a 0.
If it helps you to think about Attribute A in a concrete term, you can associate it age. Either somebody has accrued 35 years on Earth-RAM, or they have not. They are either 35 years old, a 1, or they are not. And if helps you to think about Action B, you can think of it as they will either Buy brand B, a 1, or they will not, a 0. It doesn’t really matter. A is a 1 or a 0. And B is a 1 or a 0.
Because I have created this Universe, there are no missing values. There are no import errors. There is no number 2. Or -1. There are certainly no special characters.
There is only cold, sterile, dichotomous, data.
This data, of 100,000 perfect people in a perfect bank of RAM in a machine is the absolute ground truth of the Universe. Many of you may feel bad for those people, but that’s because you’re crazy, they have no feelings, and their existence in this Universe is much better. This is what I tell the computer to create this Universe.
n = 100000
dict_a = {a: np.random.randint(0,2) for a in range(n)}
dict_b = {b: np.random.randint(0,2) for b in range(n)}
df = pd.DataFrame({'A':dict_a, 'B':dict_b}, columns=list('AB'))
As a God, I can run a query and discover the true, actual, ground truth of the Universe at any time. This forms the basis of all Judgement to come. And while I’m playing God, I’m going to instantiate twenty special agents – and task them with a few challenges.
First, I’m going to ask these agents to estimate, out of the 100,000 humans, do a majority of humans have Attribute A? How many have Attribute A?
Since I’m also a frugal God, and not much into apotheosis, I’m not just going to give these twenty agents read access to the entire human database. I’ll give them the ability to sample it. They may have a slice to check for the attribute.
sample_size = 100
agents = 20
i = 0
sample_predicted_values = {}
    while i < agents:
        df_sample = df.iloc[random.sample(range(1, n), sample_size)]
        sample_predicted_values[i] = df_sample['A'].mean()
        i += 1
df_samples = pd.DataFrame.from_dict(sample_predicted_values, orient='index')
print df_samples
These agents are able to sample at random – one may be able to interview human 99, 107, 998…and so on. One may coincidentally interview humans 998,000 to 998,999. Their interview list is generated randomly and independently from each other. The humans in RAM can’t refuse to respond. They have to respond. And they have to respond honestly. And they do respond. They get to ask 100 humans what they are. The agents do not make a mistake in recording the responses or tabulating means. They have no feelings about what the answer should be.
What I’ve set up here is a simulation. It’s a controlled environment mostly free from most of the problems caused by the real Universe out there. How would twenty agents answer the question, how many humans have Attribute A. Put a different way, how many humans in the Universe have a 1 under column A?
They’d probably add up all the ‘1” they got from those 100 humans and apply that average to the 100,000. It would stand to reason that if they asked 100 humans, and 50 of them had attribute A, that 50% of all humans would have attribute A.
What do you think these twenty agents would come back with? Would they all come back with the same answer? Would they all literally say 50%. How probable do you that is?
That probably depends on the underlining distribution. What if the randomness of the birth of this Universe produced more than 50% with Attribute A? Or less than 50%? Wouldn’t one expect np.random, or the random function contained in the numpy library, a random function, to produce something that isn’t perfectly 50%?
It would also depend on the random sample that the agent is pulling too. They’re polling 100 humans from a random list they, themselves, produce at random. And what are the odds that each agent, operating independently of each other, is going to draw the exact same 100 humans to poll? It really isn’t likely.
These twenty agents are going to return different lists of 1’s and 0’s, 100 items long, and arrive at a different percentage estimate of the ground truth. And remember, nobody, other than the God, which is me, knows the real ground truth.
Here’s how my agents did on the first run of the Universe. It’s a sorted list of what each Agent reported back, as a decimal. If it says 0.42 in the table, it can be interpreted as 42%. I sorted the list to make it easier to read. Below, you can see that Agent 3 predicted 42%. Agent 7, and Agent 9 both predicted 50%. Agent 4 predicted 60%.
Sorted
3   0.42
12  0.42
1   0.43
0   0.45
17  0.46
10  0.47
5   0.48
18  0.49
9   0.50
7   0.50
19  0.50
11  0.51
14  0.51
16  0.51
2   0.52
15  0.53
6   0.55
13  0.55
8   0.55
4   0.60
Range
0    0.18
That’s a total range of 18 percentage points!
Isn’t that interesting? It isn’t that Agent 4 is a bad person, any more than Agent 3 is a bad person. They just happened to generate very different lists, from the same Universe, and arrived at very different answers. And, you don’t know for sure if Agent 4 is right. Or if Agent 3 is right.
You might be eyeballing that list, and your gut might be telling you something. The agents, in aggregate, are returning a distribution of answers that are clustering around some figure in the middle, aren’t they? And maybe you reach for those classic summary statistics, the mean and the median, to describe the list. Maybe you take the average of the averages and end up at 49.75%. Maybe you take the median at 50%? All of these estimates, in total, are clumping near the middle.
It turns out, in this instance, the ground truth in this Universe was that 50,058 humans had Attribute A, so the Ground Truth was 50.058%. Why would God allow such a Universe to exist?!? God plays dice.
Let’s spool up another Universe, and this time, let’s loosen the strings up a bit on our Agents. Let’s gift them ten times the information. Let’s grant them the RAM to ask 1,000 random humans. What then?
Sorted
2   0.478
16  0.485
17  0.487
8   0.495
1   0.496
11  0.497
0   0.500
3   0.502
4   0.504
7   0.504
14  0.507
18  0.508
19  0.509
15  0.511
6   0.512
9   0.514
5   0.517
12  0.517
10  0.520
13  0.523
Range
0    0.045
Two very interesting things happen. For one, a set of 1000 allows for more precision in their estimates. And, second, the range is a lot tighter, just 4.5% points separate Agent 2 from Agent 13. So based off these twenty estimates, what would you say the ground truth is? Is Agent 0 right at their 50.0% estimate? Is Agent 7 at 50.4%? The mean and the median are very close to each other, around 0.504, or 50.4%. Do you feel more confident that more than half of the humans in this Universe have Attribute A?
The actual ground truth, in this example, was that 49,677 out of 100,000 humans had Attribute A. Agent 11 was more right than others. And again, just out of pure chance.
Did you feel the precision in the figures give you a false sense of confidence? Did you feel that? Insidious, isn’t?
Let’s do one more.
I’m going to give these agents a sample size of 10,000! Such generosity!
#set size of universe
n = 100000
#set size of the sample to be pulled
sample_size = 10000
Sorted
6   0.1931
13  0.1950
5   0.1956
18  0.1958
15  0.1961
12  0.1964
0   0.1967
1   0.1974
11  0.1991
3   0.1993
4   0.2000
8   0.2000
10  0.2005
16  0.2009
9   0.2009
14  0.2021
17  0.2022
7   0.2023
19  0.2026
2   0.2067
Range
0.0136
Each agent is more precise. And the range went from 0.045 to 0.0136, (4.5% down to 1.36%). Which is a bit disappointing isn’t, since I increased the the amount of sample given to each agent by a factor of 10 and only got a four factor increase in accuracy.
And all twenty agents are estimating figures far away from 50%, they’re all down at around 20%. Is Agent 3 right, at 19.93%? Is it weird that Agent 4 and Agent 8 both agree so much at 20.00%? The average of the average is right around Agent 3, 4, and 8 at 0.199, or 19.9%.
Could they all be so wrong?
In this Universe, 19956 humans had Attribute A. The right answer, the actual ground truth of the Universe, was 19.956%
Why?
dict_a = {a: np.random.choice(np.arange(0, 2), p=[0.80, 0.20]) for a in range(n)}
Because God microwaved the dice. I set p=[0.80, 0.20], manipulated the plastic in those bad boys, causing the dice to bounce a certain way – giving the odds a 20% chance of Attribute A for each human. But there was still chance at work.
You may have anchored on 0.50, so when you saw so many outliers, you may have thought there was something wrong with the agents.
Alright, so now you have some intuition for how simulation can help you understand more about the wonderful world of univariate statistics and making predictions about the ground truth of the Universe.
Controlled Universe. Controlled Agents. One variable. One prediction. Why we call it univariate (uni = one) analysis. And there’s still quite a bit of randomness.
As the amount of information made available to each agent increased, the accuracy of their predictions became better. They got better, even if it didn’t get as better as the size of data they got. I increased the amount of data they had access to by two orders of magnitude, from 100 to 10,000, and they only got better from being 9 percentage points off (18 was the total range, the agents were within 9 points of the mean) to almost a one percentage point off. And the rate that predictions get better, themselves, generalize into a predictable formula. Mathematical scientists have in turn discovered a whole bunch of observations about the way this relationship works, assigned Greek letters to some of the concepts, and have been working ever since.
This is the intuition at the root of how nature, of how randomness and chance, even against a ground truth, generalize out in the world of univariate analysis. But because we come to know nature, we can manage that, and ourselves.
Bivariate
Now we’re going to compare two things. I’m spooling up a Universe and setting A and B.
n = 100000
sample_size = 100
dict_a = {a: np.random.randint(0,2) for a in range(n)}
dict_b = {a: np.random.randint(0,2) for a in range(n)}
And now I’m going to ask my twenty agents – how many of those with Attribute A are going to do Action B?
Stated a slightly different way, how many humans have a 1 in both columns, A and B?
I’m going to start off by giving each agent 100 humans to interview. Same rules apply as above.
Here’s what Agent 6 put together from their sample.
Agent
6
Sample Crosstab
A     0   1  All
B
0    27  37   64
1    19  17   36
All  46  54  100
Here’s how to read that crosstab (sometimes it’s called a contingency table). Agent 6 interviewed 100 people. Of them, 54 had attribute A. And 36 did Action B. Agent 6 found that 17 people that had attribute A, also did Action B.
I’m reporting each agent’s count of those that had 1’s in each column, 1 for Attribute A, and a 1 for Action B.
Sorted Values 1_1
     0
6   17
1   18
11  18
16  19
17  20
15  20
0   21
18  22
2   23
4   23
12  23
7   24
8   24
9   25
3   26
13  26
19  26
14  30
5   33
10  38
Range of Values 1_1
0    21
And as you can see, agents would estimate a value as low as 17 (Agent 6) to as high as twice that, 38 (Agent 1)! It’s trivial here to put those into percentages – a range that varies from 17% to 38%.
The ground truth figure was 25,180, (or 25.180% had both Attribute A and did Action B).
Universal CrossTab
A        0      1     All
B
0    24863  24906   49769
1    25051  25180   50231
All  49914  50086  100000
So what happens when I give the agents a sample of 1000?
#set size of the sample to be pulled
sample_size = 1000
And we find that the agents are returning a tighter range, which is what we expected.
Sorted Values 1_1
      0
0   219
16  224
11  236
17  241
14  241
13  241
9   241
10  242
12  248
18  249
8   250
1   250
15  251
7   254
6   255
5   258
3   261
19  261
2   267
4   270
Range of Values 1_1
0    51
And it tightens. Agent Zero estimates 21.9%, Agent Four estimates 27.0%. Which are much tighter in against the ground truth, which was 25.202%.
Universal CrossTab
A        0      1     All
B
0    24996  24858   49854
1    24944  25202   50146
All  49940  50060  100000
So what happens when I give the agents a sample of 10000?
#set size of the sample to be pulled
sample_size = 10000
And we find that the estimates are narrowed again.
Sorted Values 1_1
       0
8   2417
12  2426
2   2427
10  2436
15  2454
5   2464
18  2476
19  2486
9   2489
7   2489
0   2525
14  2530
1   2530
3   2538
13  2538
4   2543
6   2546
11  2546
17  2560
16  2570
Range of Values 1_1
0    153
Which is good, against the ground truth of the situation.
Universal CrossTab
A        0      1     All
B
0    25197  24885   50082
1    24772  25146   49918
All  49969  50031  100000
So as you can see, more information helps the agents greatly in making a more accurate estimate of the ground truth.
So far, so good.
Next, I’m going to ask my agents a different question – what is the relationship between Attribute A, and Action B?
So I recreate the Universe, and give every agent a sample of 100.
#set size of the sample to be pulled
sample_size = 100
Here’s what Agent 17 discovered when they went out into the Universe.
Agent
17
Sample Crosstab
A     0   1  All
B
0    26  25   51
1    26  23   49
All  52  48  100
So what can deduce about the Ground Truth of the Universe from this distribution? Well perhaps not much. If Attribute A had nothing to do with Action B, one might expect there to be a number around 25 in each cell. The number of people with Attribute A and doing Action B would be around 25 (And down below, I’ll report out the expected values). And we look above, and we can see that the Agent can’t really make a prediction using information about A.
If Agent 17 was sitting in a room, and I sent a human at random in there, and the person said if they had Attribute A, the Agent might guess that they were going to do Action B in the future (23/48 = ~48%). But given how small the numbers are, Agent 17 couldn’t really say for sure. They wouldn’t be very confident in that prediction.
Agent 5 would have a different relationship with reality based on their experience.
Take a look at what Agent 5 discovered.
Agent
5
Sample Crosstab
A     0   1  All
B
0    30  18   48
1    21  31   52
All  51  49  100
Agent 5 found that if somebody had Attribute A, 31 times out of 49, that human also did Action B (63% of the time). That’s pretty lopsided. So if you sent a random human into a room with Agent 5, and that human said they had Attribute A, Agent 5 would estimate they’d have a 63% chance that the human would do Action B. They might be pretty confident about that prediction.
That relationship, between a prediction and the confidence in it is quantified in a bunch of equations, rooted in observations, and expressed in Greek letters. I’m going to give them the gift of knowing about a Greek Letter called Chi, and have them report what they calculate.
The way Chi Squared is calculated is by taking the difference between what the agent observes in each cell in the crostab table, and what the agent would expect to see if there was no relationship between A and B, and then square it. Then they divide that number by what was expected. Add all of these together and one gets the Chi Squared value. (The Greek letter Chi looks like a Latin X).
For intuition, the greater the excursion from what’s expected, the greater the Chi Squared value.
The relationship between the Chi Squared value and the probability that it’s independent is moderated by a concept called the degrees of freedom. We have a 2×2 crosstab table here, so the total number of degrees of freedom is just 1. Just one degree of freedom. Check out the black line, the one furthest to the bottom of the chart, below.
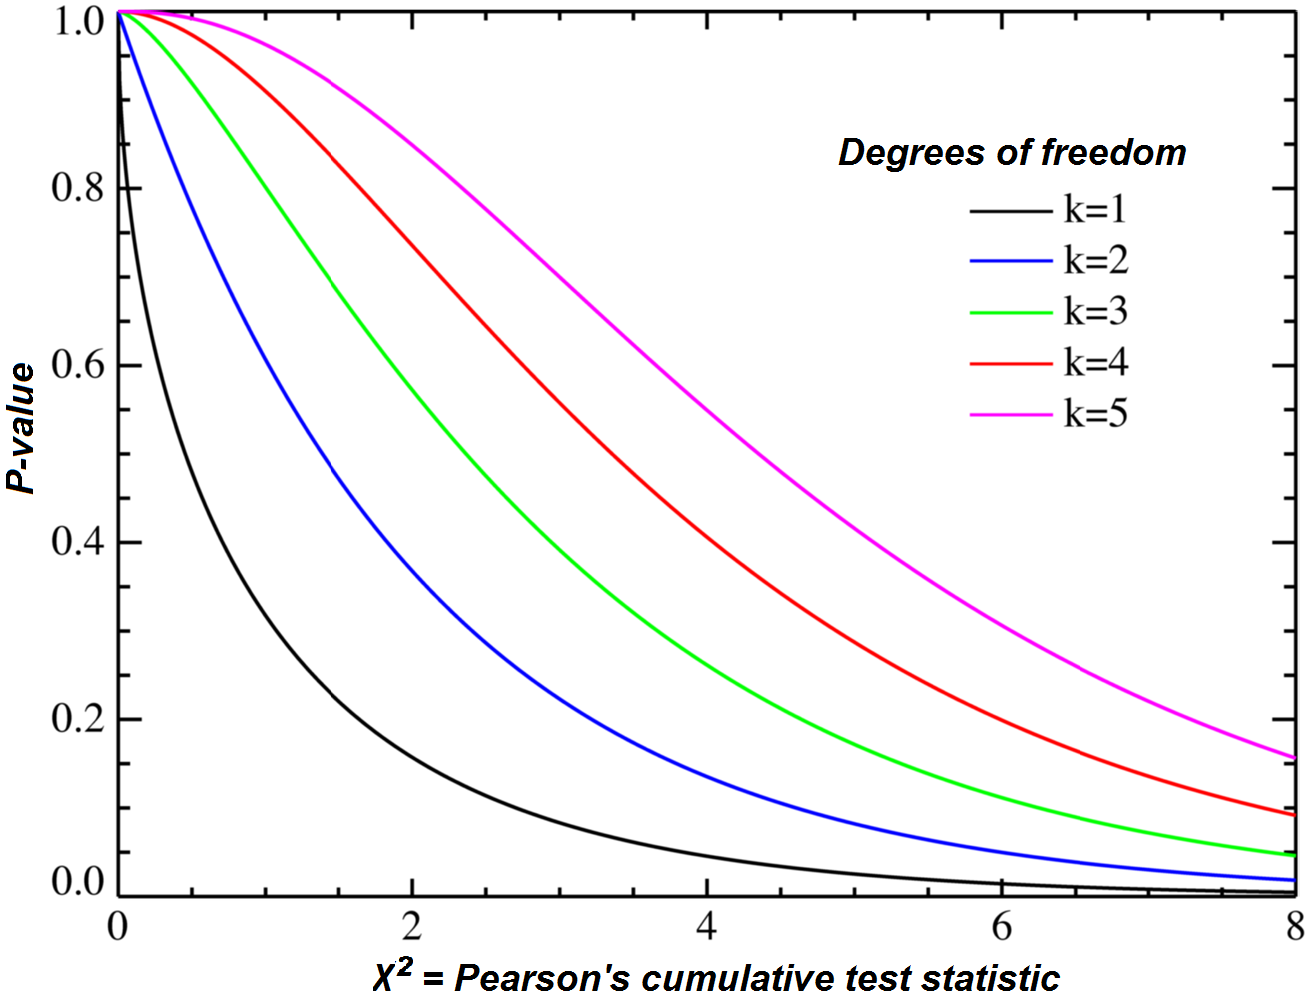
As the excursion from what’s expected increases, the Chi Square value returned from the calculation increases. As the Chi Square value increases, the P-value, or the probability that there is no relationship between the two, goes down. High departures from the expected cause high Chi Square values, and high Chi Square values cause low p-values. Low p-values help us understand the probability that A and B are not independent. And this point, about what a p-value means, is quite tortured and debated about. It wasn’t obvious to most real humans until the 1700’s and a human called Pearson didn’t make the connection until 1900. But I’m going to give this knowledge to my Agents for free. (I spoil them!)
chi2, p, dof, expected = stats.chi2_contingency(obs)
I’m going to ask all 20 agents to report on back to me how sure they are that there is no relationship between Attribute A and Action B.
P VALUES
           0
5   0.044430
1   0.069816
16  0.243300
4   0.378896
12  0.399213
2   0.408720
7   0.408720
14  0.460522
19  0.488906
8   0.500817
18  0.545683
0   0.558591
10  0.595316
6   0.669254
11  0.689098
3   0.716851
13  0.776825
9   0.935711
15  0.993611
17  0.993611
Agent 17 reports a 99.3610601185% chance that there is no relationship between Attribute A and Action B. As does Agent 15.
Agent 5 reports a 4.44300910571% chance that there is no relationship between Attribute A and Action B.
And you can see here, the chances that there is no relationship between A and B vary from 4.44% all the way to 99.36%. Now remember, everything in Agent 4’s experience tells them that there are pretty good odds that there is a relationship between A and B.
What effect does giving my agents more sample have? Let’s increase it by a factor of 10.
#set size of the sample to be pulled

sample_size = 1000
And we check out the probabilities that the A isn’t related to B.
P VALUES
           0
6   0.036959
13  0.076433
0   0.096252
7   0.107040
15  0.141339
17  0.161236
1   0.168180
3   0.227854
14  0.229311
4   0.294523
19  0.366309
9   0.368254
10  0.477954
18  0.531879
5   0.546537
16  0.584444
8   0.728194
11  0.874022
2   0.895047
12  0.994750
And we see right away that Agent 6 has something unusual.
Agent
6
Sample Crosstab
A      0    1   All
B
0    261  228   489
1    238  273   511
All  499  501  1000

Sample A Mean
0.501
Sample B Mean
0.511
Sample 1-1 Mean
273
CHI STATS FOR THIS AGENT
p
0.0369586132321
chi2
4.35231785869
dof
1
expected
[[244.011 254.989]
 [244.989 256.011]]
Agent 6 observed 273 people with both Attribute A and Action B – so they could predict that somebody doing Action B, given Action, 54.5% of the time, which is better than even odds. They report that there’s just a 3.6958% chance that the relationship between A and B is a fluke. This is their experience. All the other agents report that there’s no relationship between A and B.
What about the ground truth of Universe?
Universal CrossTab
A        0      1     All
B
0    25032  24941   49973
1    25202  24825   50027
All  50234  49766  100000
CHI STATS FOR THE UNIVERSE
p
0.36956011438
chi2
0.805143058414
dof
1
expected
[[25103.43682 25130.56318]
 [24869.56318 24896.43682]]
Nope. There isn’t a relationship. There’s no relationship between A and B.
Let’s amp the sample size up to 10,000 and see what happens.
#set size of the sample to be pulled
sample_size = 10000
Agent Zero, even with 10,000 in sample, reported a relationship.
P VALUES
           0
0   0.017687
9   0.061001
10  0.065904
18  0.105137
19  0.122991
3   0.209514
4   0.281474
12  0.326845
13  0.364398
14  0.433251
11  0.519662
1   0.521283
2   0.531240
6   0.560125
15  0.605112
5   0.688567
7   0.890137
17  0.900055
8   0.929782
16  0.955363
Upon closer inspection of Agent Zero, we see why:
Agent
0
Sample Crosstab
A       0     1    All
B
0    2524  2505   5029
1    2376  2595   4971
All  4900  5100  10000

Sample A Mean
0.51
Sample B Mean
0.4971
Sample 1-1 Mean
2595
CHI STATS FOR THIS AGENT
p
0.0176866154165
chi2
5.62692654471
dof
1
expected
[[2464.21 2435.79]
 [2564.79 2535.21]]
Even though the Ground Truth, indeed, indicates that A and B are not related.
Universal CrossTab
A        0      1     All
B
0    24909  24958   49867
1    25053  25080   50133
All  49962  50038  100000
CHI STATS FOR THE UNIVERSE
p
0.949061729484
chi2
0.00408130392167
dof
1
expected
[[24914.55054 25047.44946]
 [24952.44946 25085.55054]]
Again, Agent Zero isn’t a bad human. It’s just that they got unlucky. Their experience of the Universe leads them to believe that there is a relationship between A and B, even though there isn’t. Even with a sample of 10,000.
In all Four of these Universes, there was no relationship between A and B. Aside from showing you the ground truth and the related statistics, I can prove it by showing you the way I created the Universe.
dict_a = {a: np.random.randint(0,2) for a in range(n)}
dict_b = {a: np.random.randint(0,2) for a in range(n)}
A and B are independent because they were created independently. They were willed into being using two separate random distributions, at two different times (one followed the other) and they have nothing to do with each other, other than existing in the same Simulated Universe together. The fact that it seemed like usually, one agent out of twenty always thought there was a relationship is predictable. It’s just that no agent ever believes that they’d be so unlucky.
At sample = 100:
Sample Mean P VALUE
0    0.419183
Sample Range P VALUE
0    0.933486
At sample = 1000:
Sample Mean P VALUE
0    0.417475
Sample Range P VALUE
0    0.976968
At sample = 10000:
Sample Mean P VALUE
0    0.536264
Sample Range P VALUE
0    0.887396
The P-value range doesn’t become any tighter or more consistent, across the agents, as sample goes up. There is no tightening of certainty at scale.
What if I create a universe where A is related to B?
What if A is correlated to B. What if they’re not only just correlated, but I make A cause B? Naked. Pure. Causality.
dict_a = {a: np.random.choice(np.arange(0, 2), p=[0.50, 0.50]) for a in range(n)}
dict_b = {}

for key, value in dict_a.iteritems():
if value == 0:
dict_b[key] = np.random.choice(np.arange(0, 2), p=[0.80, 0.20])
if value == 1:
dict_b[key] = np.random.choice(np.arange(0, 2), p=[0.20, 0.80])
For each human created from the void, they’ll have a 50:50 chance of getting Attribute A. For those who do not get Attribute A, there is a 20% chance they will do Action B. If they have Attribute A, there is an 80% chance they will do Action B. It is this way because I say it is. The determination of a 0 or a 1 under Action B is determined by, is because of, having Attribute A. It is causal both in terms of time, and in terms of definition. That’s just how I created the Universe. (This is beauty of simulation!)
So I set the agents sample size to 100.
sample_size = 100
And they all come back with very low p-values.
P VALUES
               0
5   7.640166e-13
3   2.970227e-11
10  1.440464e-10
14  5.218926e-10
18  6.594466e-10
8   1.845767e-09
0   1.958641e-09
16  1.958641e-09
13  2.338188e-09
12  2.387777e-09
17  3.596767e-09
11  6.236816e-09
9   1.713752e-08
1   5.138308e-08
4   5.508875e-08
6   5.805862e-08
7   2.820377e-07
2   4.233467e-07
15  4.403962e-06
19  1.220610e-05
And, for intuition, let’s check out why Agent 5 came back with such a low value:
Agent
5
Sample Crosstab
A     0   1  All
B
0    38   6   44
1     7  49   56
All  45  55  100
Sample A Mean
0.55
Sample B Mean
0.56
Sample 1-1 Mean
49
CHI STATS FOR THIS AGENT
p
7.64016573956e-13
chi2
51.3724911452
dof
1
expected
[[19.8 25.2]
 [24.2 30.8]]
As you can see, one would expect 30.8 people in the sample to have 1′ both A and B, and the observed value was 49. Add up all of these variations, and we get a high chi squared value of 51, which produces a very low p-value. If a person walked into a room with Agent Five and told them they had Attribute A, they’d predict that the person would do Action B 90% of the time.
And that’s within a good range of what Universe says it really is – what the ground truth really is – it’s pretty close.
Universal CrossTab
A        0      1     All
B
0    39894   9935   49829
1     9960  40211   50171
All  49854  50146  100000
CHI STATS FOR THE UNIVERSE
p
0.0
chi2
36249.5631917
dof
1
expected
[[24841.74966 25012.25034]
 [24987.25034 25158.74966]]
Alright, let’s boost the sample size to 1,000
sample_size = 1000
And see what happens:
P VALUES
               0
14  2.267577e-89
18  5.482615e-89
6   6.981511e-89
17  7.188154e-89
7   5.035317e-88
5   1.285554e-85
19  7.385426e-85
2   2.342636e-84
15  2.376226e-84
0   2.140627e-81
13  3.776932e-81
10  8.144878e-80
11  4.849325e-79
9   3.542902e-78
16  8.106565e-78
1   1.250593e-75
3   1.762194e-75
12  5.910935e-75
4   6.113513e-75
8   8.353442e-69
Sample Mean P VALUE
0    4.176729e-70
Sample Range P VALUE
0    8.353442e-69
And the Agent’s generally agree with the ground truth of the Universe.
Universal CrossTab
A        0      1     All
B
0    40081   9984   50065
1     9951  39984   49935
All  50032  49968  100000
CHI STATS FOR THE UNIVERSE
p
0.0
chi2
36153.7396954
dof
1
expected
[[25048.5208 24983.4792]
 [25016.4792 24951.5208]]
And let’s do it again, with a higher sample for each agent:
P VALUES
      0
0   0.0
17  0.0
16  0.0
15  0.0
14  0.0
13  0.0
12  0.0
11  0.0
10  0.0
9   0.0
8   0.0
7   0.0
6   0.0
5   0.0
4   0.0
3   0.0
2   0.0
1   0.0
18  0.0
19  0.0
Sample Mean P VALUE
0    0.0
Sample Range P VALUE
0    0.0
And these agree with the Universe.
Universal CrossTab
A        0      1     All
B
0    39892   9882   49774
1     9978  40248   50226
All  49870  50130  100000
CHI STATS FOR THE UNIVERSE
p
0.0
chi2
36333.9440092
dof
1
expected
[[24822.2938 25047.7062]
 [24951.7062 25178.2938]]
Our Agents are able to make good statements about relationships when God is leaning, 80/20, on the Universe.
What happens to the Agent’s ability to predict if we don’t make it so obvious?
dict_a = {a: np.random.choice(np.arange(0, 2), p=[0.50, 0.50]) for a in range(n)}
dict_b = {}

for key, value in dict_a.iteritems():
if value == 0:
dict_b[key] = np.random.choice(np.arange(0, 2), p=[0.55, 0.45])
if value == 1:
dict_b[key] = np.random.choice(np.arange(0, 2), p=[0.45, 0.55])
In this Universe, there’s a 50/50 chance of having Attribute A, and if given Attribute A, there’s a 55% chance of doing Action A. The dependence of B on A is quite a bit more nuanced, but you see that it’s still there.
P VALUES
           0
16  0.002654
14  0.022877
9   0.028232
1   0.047574
5   0.054960
3   0.101809
10  0.106456
0   0.124586
8   0.133113
11  0.219751
6   0.305201
15  0.355469
2   0.418625
18  0.446463
19  0.525728
12  0.551016
7   0.862065
13  0.902446
4   0.916301
17  0.974134
Sample Mean P VALUE
0    0.354973
Sample Range P VALUE
0    0.97148
Four agents out of twenty, 16, 14, 9, and 1, experienced P-Values that are less than 0.05.
And this Universe is very, very clear – there is dependence.
Universal CrossTab
A        0      1     All
B
0    27433  22344   49777
1    22492  27731   50223
All  49925  50075  100000
CHI STATS FOR THE UNIVERSE
p
7.52459087194e-234
chi2
1066.14820878
dof
1
expected
[[24851.16725 25073.83275]
 [24925.83275 25149.16725]]
Let’s see if more data helps my agents make better predictions?
sample_size = 1000
And the P-values narrow:
P VALUES
           0
12  0.000003
5   0.000006
1   0.000012
14  0.000017
11  0.000023
7   0.000148
19  0.000148
8   0.000173
18  0.000192
17  0.000709
15  0.000713
10  0.000942
3   0.002926
9   0.004837
4   0.006401
2   0.008387
6   0.010469
0   0.030132
16  0.057896
13  0.059988
Sample Mean P VALUE
0    0.009206
Sample Range P VALUE
0    0.059985
And in this instance, all agents but two, 16 and 13, experienced P-values less than 0.05. Pretty good.
We boost the sample to 10,000 each.
sample_size = 10000
And rerun the Universe.
P VALUES
               0
19  2.425200e-33
14  4.308918e-31
15  8.251558e-28
10  8.948502e-28
6   1.468066e-27
13  1.027866e-26
3   1.606491e-26
4   1.693300e-26
12  2.170612e-26
2   3.552389e-26
7   5.560343e-25
1   2.823116e-24
0   1.003131e-23
16  2.671182e-23
18  4.844996e-23
11  1.348288e-21
8   1.514325e-21
17  2.494315e-21
5   5.137547e-21
9   1.729439e-17
Sample Mean P VALUE
0    8.652486e-19
Sample Range P VALUE
0    1.729439e-17
And the P-values narrow even more. All the Agents would agree – B and A are correlated. And they match up with the Universe.
Universal CrossTab
A        0      1     All
B
0    27418  22720   50138
1    22104  27758   49862
All  49522  50478  100000
CHI STATS FOR THE UNIVERSE
p
4.27806977209e-235
chi2
1071.87737866
dof
1
expected
[[24829.34036 24692.65964]
 [25308.65964 25169.34036]]
What if I make a Universe where Attribute A is anomalous – just 5% probability that a human would have it, and what if it just gives that 55/45 Action B split? Note that there’s still a causal arrow in the data. It’s just a lot weaker.
dict_a = {a: np.random.choice(np.arange(0, 2), p=[0.95, 0.05]) for a in range(n)}
dict_b = {}

for key, value in dict_a.iteritems():
if value == 0:
dict_b[key] = np.random.choice(np.arange(0, 2), p=[0.55, 0.45])
if value == 1:
dict_b[key] = np.random.choice(np.arange(0, 2), p=[0.45, 0.55])
And I start off the Agents with a sample of just 100.
P VALUES
           0
15  0.187727
2   0.200325
13  0.206507
3   0.289892
1   0.290413
0   0.470615
9   0.472737
7   0.510751
6   0.673700
10  0.727745
16  0.777826
5   0.817648
17  0.817648
11  0.826133
8   0.894095
19  0.905466
18  0.917037
14  0.949945
12  1.000000
4   1.000000
Sample Mean P VALUE
0    0.64681
Sample Range P VALUE
0    0.812273
And we see that none of the agents were able to spot the dependence. Even though in this Universe, it is there.
Universal CrossTab
A        0     1     All
B
0    52269  2328   54597
1    42689  2714   45403
All  94958  5042  100000
CHI STATS FOR THE UNIVERSE
p
7.45561589877e-35
chi2
151.676711965
dof
1
expected
[[51844.21926 43113.78074]
 [ 2752.78074  2289.21926]]
So, we’re going to boost the sample to 1000.
sample_size = 1000
And we find that six agents are able to pick it up.
P VALUES
           0
16  0.001622
19  0.007936
3   0.008558
9   0.015707
14  0.018716
13  0.036360
11  0.057232
4   0.089602
12  0.105284
8   0.222948
15  0.244618
1   0.248235
5   0.274044
0   0.327197
17  0.448070
10  0.481531
2   0.513948
18  0.566968
6   0.575433
7   0.602760
Sample Mean P VALUE
0    0.242338
Sample Range P VALUE
0    0.601138
But the Universe says that it’s there,
Universal CrossTab
A        0     1     All
B
0    52166  2230   54396
1    42887  2717   45604
All  95053  4947  100000
CHI STATS FOR THE UNIVERSE
p
1.98924420195e-41
chi2
181.771280722
dof
1
expected
[[51705.02988 43347.97012]
 [ 2690.97012  2256.02988]]
In the final run, we give them the full 10,000 sample size
sample_size = 10000
And we find that all the agents pick it up.
P VALUES
               0
14  1.743448e-09
4   1.713640e-08
0   9.902143e-08
7   1.935761e-07
9   7.475067e-07
17  3.601266e-06
15  3.666506e-06
13  5.525651e-06
6   1.075299e-05
12  2.196981e-05
10  2.213179e-05
3   2.672497e-05
1   2.791613e-05
19  4.573572e-05
11  7.288003e-05
16  1.366004e-04
18  1.926298e-04
2   2.279910e-04
8   2.320205e-04
5   2.297855e-03
Sample Mean P VALUE
0    0.000166
Sample Range P VALUE
0    0.002298
Which agrees with the Universe.
Universal CrossTab
A        0     1     All
B
0    52402  2256   54658
1    42567  2775   45342
All  94969  5031  100000
CHI STATS FOR THE UNIVERSE
p
1.28720079078e-46
chi2
205.546021449
dof
1
expected
[[51908.15602 43060.84398]
 [ 2749.84398  2281.15602]]
A lot more sample helped the agents understand that a small relationship, within an anomaly (at 5% of the humans having Attribute A) was present in the Universe.
Segmentation
Much of the work that is segmentation is about observing some Attribute A, and running test for correlation against some Action B. The machinery around the word because, is made by the human involved, not the chi square test of the p-value. Chi and p make no statement about causality, they just make a prediction about independence.
The reason for bothering with chi and p-value in the first place is because if one can understand the relationship between an Attribute and an Outcome, they can predict it, and prediction is the key to acting.
Many commercial segmentations one encounters make use of multiple Attributes, like age, gender, income, previous purchase, number of children, marital status, and location, to make a prediction. This increases the number of degrees of freedom, which i turn has a predictable effect on p-values and each agent’s ability to reject the null the hypothesis, or discover exploitable knowledge. In the end, most segmentation boils back to a 2×2 Pearson’s Chi Square test with a single degree of freedom. One either has the attribute of 35+Male+Lower_Income+3children+married+urban, or not. That accumulation of attributes into a single one has the effect of reducing the size of a single cell where the 1 and the 1 line up, that true-positive, sweet spot. One pays the cost of uncertainty by either inflating the degrees of freedom or reducing the size of the segment.
The Problem
The generalized concern, the problem, is the sensitivity of the statistical test for independence, to the size of the segment, is much greater than is generally understood. In the simulations in this post, we demonstrated that even with a sample size of 1000, just six agents were able to pick up (at p < 0.05) on a segment that was clearly there (5% of the population), with an exploitable feature (55:45 for purchase).
In fact, the number of agents that were able to detect the segment were [4, 4, 4, 6, 3] on successive runs.
This took place in a simulation. In a world that I created, with a direct, and I assert, causal link, between A, and then the generation of B. The sample was pulled, at random, from the Universe. And, we knew the Ground Truth of the Universe with absolute certainty (because we created it). There’s none of the usual problems with the real Universe. No census whose credibility we can quibble about. No transcription error. No pesky human with a fat finger. No liars. And nowhere did the God get shifty and changed Confidence Levels randomly. The agents were all super sharp and good professionals.
The segment was there, and, most agents missed it.
If the sample size is increased to 3000, a general size, we get a boost in the predicability – as [12, 13, 12, 10, 15] agents managed to pick it up (p<0.05). Again, that sensitivity, from 1000 to 3000, is the difference between most commercial sampling studies.
Big Problem? Big Data?
So what, one might say, why sample when I have all the data?
We simulated several universes where there was absolute independence between A and B, and we found, consistently, that one agent in twenty was finding evidence of dependence. We saw this often.
At industry conferences, I have encountered practitioners that will argue the correlation must exist if it was discovered, even in the case of correlating an astrological sign with the medication condition of breaking a leg. They insist that it is a problem with the sampling, or that more sample size always solves the problem. However, even with this sterile, simulated, data, sampling 10,000 records out of a ground truth of 100,000, one agent was still tricked by randomness into stating there was an exploitable segment when there very clearly wasn’t one.
You now have more intuition about the structure of the Universe than they do.
Conclusion
Six years ago I wrote WTF repeatedly in the margins during a presentation. What I learned there worried me, and it wasn’t until I started running more simulations on my own that I truly appreciated what was happening deep down there.
The best practical advice that I can offer data scientists in industry is to look for big, bold, segments. Look for big chi squares and very tiny p-values. Be aware that a promising segment might not actually exist even if the p-value is under 0.05, or even under 0.01. You may be an unlucky agent. And you wouldn’t know any different.